
How has the economy changed over the last 50 years?
The comparison with King Louis in the 18th century was easy because many of the things we have now were not available then. It is a little more debatable to make the comparison to the early 1970s but let’s start building up a picture. With the stories in this example, don’t focus too much on them being precisely 50 years ago but around that time.
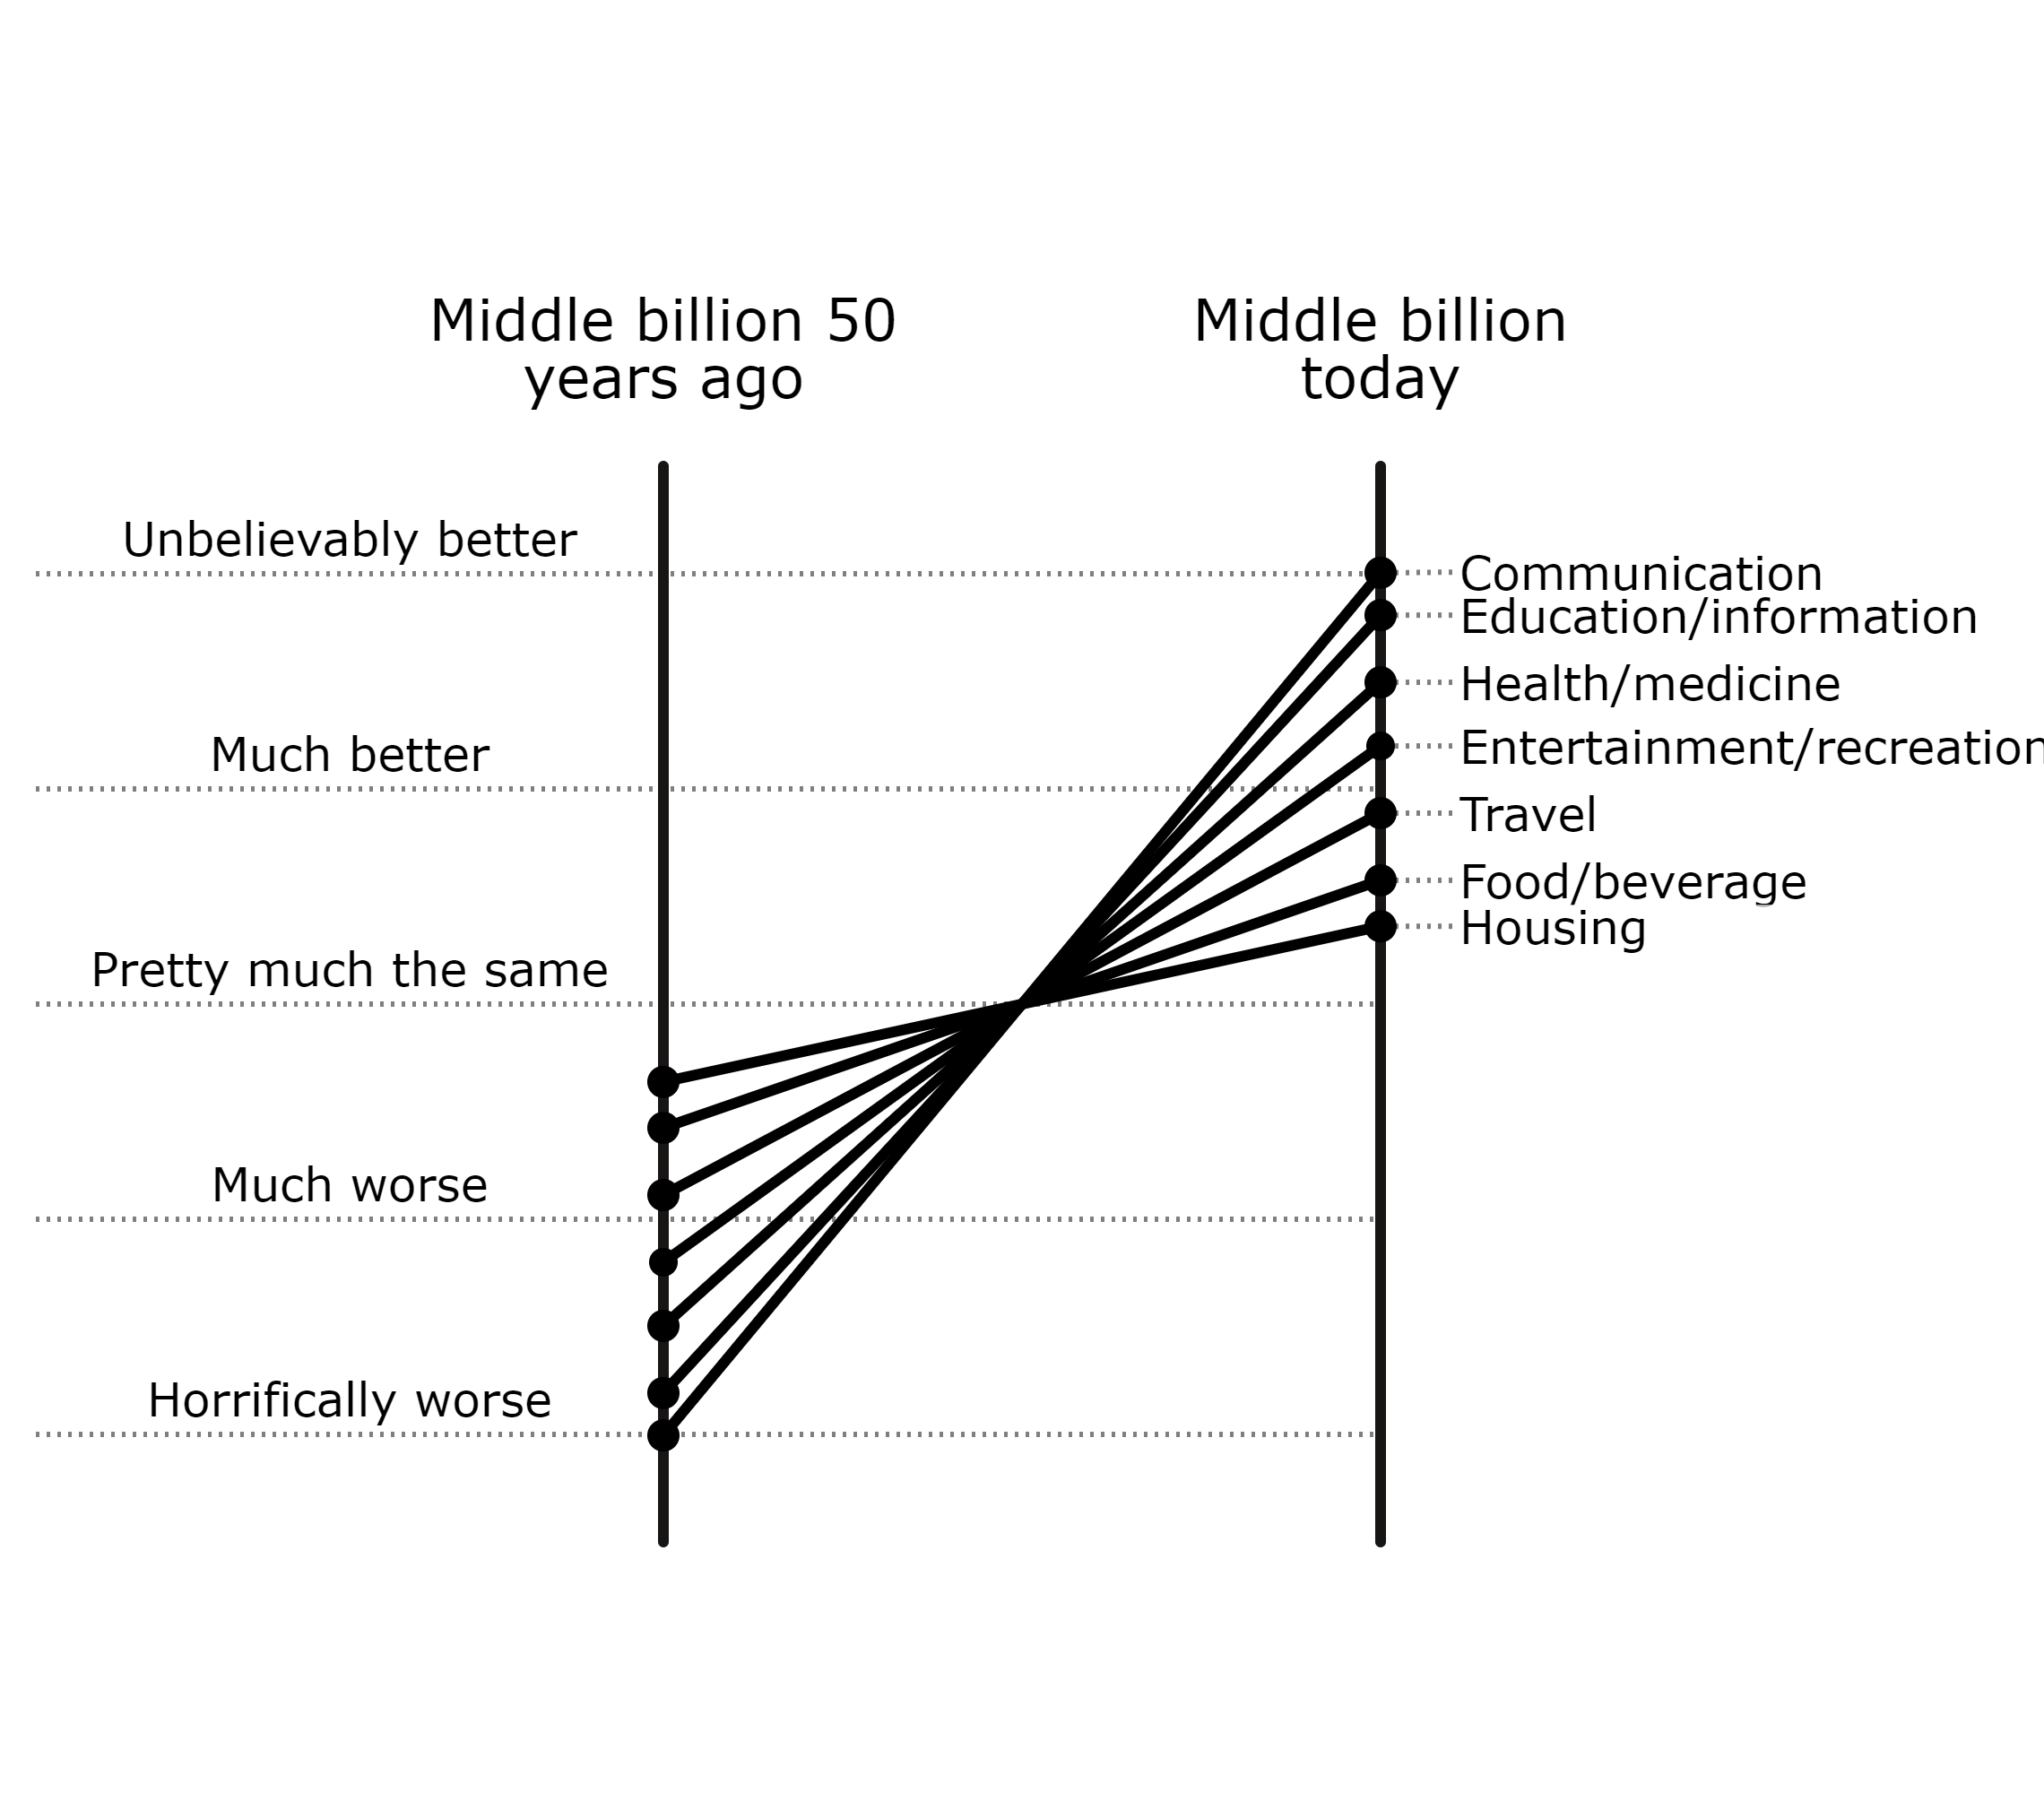
As a reminder, the method for building up the picture is to rattle off some stories about the difference between the two time periods and put a line on the comparonomic graph. I purposefully try to illustrate not with data but stories, so they are memorable. Other authors have done a sensational job of putting together hard-core data that highlight this same progress. If you prefer this form of evidence, I’d recommend Steven Pinker’s book Enlightenment Now: The Case for Reason, Science, Humanism, and Progress, or websites like ourworldindata.org or humanprogress.org.
The slope of the line on comparonomic graphs is always debatable, but the direction typically isn’t. Don’t get too hung up on the exact gradient of the line, as it is subjective. Feel free to make your own version of the comparonomic graph.
In the examples below, I purposefully pick some of the most dramatic examples and stories to illustrate how much things have changed. This is not a proof that everything has got better, but there does seem to be a consistently positive trend in many things.
In these examples, I never talk about price, cost, or affordability because there are so many embedded assumptions in the way these things are defined. I ask, ‘What was it like 50 years ago for the middle income people in OECD and what is it like now?’ Would you swap what they had on average with what we have on average now? How strongly do you feel is the difference?
Health
Below is a list of facts comparing health and medicine from 50 years ago:
• The link between smoking and poor health was not widely accepted. It was not that long since the Flintstones were advertising cigarettes and beer.
• Cancer survival rates were half what they are now.
• Since then, thousands of procedures and medicines have been invented or improved.
• Pacemakers and heart surgery have gone from being rare and expensive to ordinary and accepted as not such a big deal.
• There were protests on the street about the first IVF fertility treatments but they are standard now, and we don’t think twice about them.
• A hip replacement is considered one of the most life-transforming procedures, adding years of quality to later life. It’s not uncommon to hear complaints about the cost of hip replacements or delays in getting them but remember no one had them 50 years ago (not even kings).
• The speed of development of treatments and vaccines for pandemics is dramatically better. We are likely to always have outbreaks of infectious disease and from a medical point of view it’s much better to have the medical tools we have now. There is no better time in history for Covid-19 to turn up.
This topic can be emotionally challenging because it is so easy to jump to the question of how broken, unfair or expensive current health care is. We probably have strong views on the reasons health is costly or unjust and why different countries have better systems. It’s normal to have strong opinions on these things but they are irrelevant for this analysis. Put them to one side and compare the level of service for the middle billion now and 50 years ago.
It is also hard not to jump into the question of how health is likely to change in the future. There is significant evidence for flattening of life expectancy possibly due to obesity, and our collective health could decline. Or if you believe the optimists we are on the verge of solving old age with new technologies. Both things I purposefully put to one side because they are about guessing why things change or what is going to happen in the future. Let’s focus on the state of health for the average person now compared to 50 years ago.
If someone could offer you a health system in which the average person lived 10–15 years longer, you would find that offer unbelievably better. If health becomes so bad the average life expectancy goes down by 10–15 years, you would probably find that horrifically bad. There is no question our state of health/medicine is vastly better than 50 years ago, and it is a personal guess as to the slope of the line.

Education/information
Education and information are grouped together because it is a combination of how much you know and how easy it is to know it. It is probably easy to sit back and think education was better in the good old days. Below are a few facts on things we didn’t know, and facts about how easy it is to get access to information compared to 50 years ago:
• We didn’t know about global warming — in fact, we worried about an ice age.
• We thought putting lead in fuel was a good thing but were poisoning the general population.
• If you wanted to find out something, you would head off to the library — there were no search engines. As much as we complain about alternative facts, it is easy to forget how much less rubbish people can spout on about these days. Most things that sound dodgy we can immediately fact-check. The record number of children by one woman — 69? Yep — easy to check. It rains diamonds on Saturn. Cambridge University is older than Aztec civilisation. Quick as a flash easy to find out and check almost anything.
• It is possible that because of smartphones, we have faster, more accurate access to information than the most powerful person in the world when Bill Clinton was president.
If you could offer today’s access to information to someone from 50 years ago, they would be astonished. It would seem like magic. Try getting anyone to do research for a project and take the internet from them. It seems horrifically primitive having to use microfiche at the library.
One of my favourite examples of this is how in some countries it is now considered a fundamental human right to have broadband internet access. Well, you know the wealthiest billionaire in the world didn’t have it 15 years ago. Things go from impossible to fundamental human right in the blink of an eye. You could only draw a very steep line to describe the progress we have made in this part of the economy.

Travel
Travel is something that has not changed too much in the core functionality for the last 50 years. Our main ways of getting around are still cars, bikes, trains, and airplanes. There is a vast amount of evidence that all these forms are used more frequently and are of higher quality:
• Air travel has gone from a novel luxury to a mundane thing that most of the middle billion would do reasonably regularly.
• Average cars now have air-con, fuel efficiency, airbags, and seatbelts. They are vastly more reliable, and the days of keeping water, oil, and tools for fixing your car are mostly gone.
• Bikes have disc brakes, suspension, gear options galore but still have those lovely bells.
• Apps make public transport vastly easier in a modern city. Options for train, bus, walking, Uber or any combinations are easy to see.
• Even a good weather app can make the choice of walking more likely to turn out well.
• You were two to eight times more likely to die in a car crash 50 years ago (depending on where you are from).
• You were six times more likely to die in an airplane crash 50 years ago.
• But we also have congestion, airport security checks, and associated hassles.
I doubt anyone would swap accessibility of flights and functions of cars for versions from 50 years ago. Transport is much better now but probably not unbelievable. I suspect driverless cars and even flying vehicles are set to transform the safety and price of travel even further, but that is irrelevant for this discussion given our agreement to refrain from speculating on the future. Would you give up modern transport for that of 50 years ago?

Communication
As discussed earlier, communication would not typically be an economic sector of a similar size to housing and health. One of the points of this analysis is that it is not the dollar size of an economic sector but also how much time we spend using it.
Our daily life is full with the use of communication tools that would be considered unbelievable to anyone 50 years ago. Take a simple telephone call. Sure, they had them, but now they are next to free from anywhere. Then there is the amount of time we spend on email, texting and all the wonders of a smartphone. An analysis of the latest iPhone compared it to its performance with 1957 technology:
* cost 150 trillion of today’s dollars: one and a half times today’s global annual product
* drawn 150 terawatts of power—30 times the world’s current generating capacity.
You can only draw a very steep line to show the progress of communication tools and services over the last 50 years.

Food/beverage
Food and beverage have probably not changed as dramatically for the average person in the last 50 years. There is almost certainly an extensive range of things a time traveller would miss about what we have now. Remember for simplicity’s sake the top 10% and bottom 10% of people are excluded from this analysis. How have things changed for the middle billion?
• How has the quality of coffee changed over 50 years?
• I remember cask wine came in two main types, red or white.
• Look at some cooking books or food magazines from the early 1970s. Very few magazines and obviously no blogs.
• The term ‘foodie’ didn’t appear until the 1980s.
• Lettuce used to mean iceberg — what else was there?
• Bland white bread was often the norm.
• Cheese came in big blocks, and the cheese options at most stores now would seem unknown to someone from the 1970s (unless you were in parts of Europe, of course).
• Potatoes were mostly mashed or baked.
• I remember hearing about the odd practice of eating raw fish as a child. This seemed exotic and a little crazy but now it is a familiar food option for much of the middle billion.
• We eat out much more often than 50 years ago and my guess is that restaurant food quality is vastly better in general.
• These is some evidence that average nutrition values of food have fallen but it is hard to tell for sure given the poor test and data from 50 years ago.
• We do know they used large quantities of chemicals in the past that are now banned. As an example, in early 1970s they were still using 40,000 tons of DDT annually. You would struggle to get organic food even if you wanted to.
• Food labelling was mostly non-existent 50 years ago so you often didn’t know what additives were in the food purchased.
One of the best ways to think about how this has changed is to ask yourself, if you had the choice of food and beverage now compared to what was on offer to the middle billion 50 years ago, what would you choose? And then how strongly you feel about that, to put a slope on the line. I look at a lot of the foods I love now that were not as freely available — sushi, avocados, cos lettuce, craft beer, French-style cheese, wholegrain breads, gourmet sausages, boned chicken, fresh herbs and ethnic food options. You may have a different view on things, and that’s fine. The questions are ‘What is important to you?’ and ‘How has this changed?’
For this sector of the economy, I’ve put a moderately sloped line to show that food and beverage have improved but not as much as other sectors of the economy.

Housing
Housing is something that probably has not changed dramatically on average. The size of the average house has increased significantly in some countries (e.g. US, Australia) but not as much in Asia and Europe. The building regulations in most countries have moved on so much that a typical home built 50 years ago would be illegal to build now. Usual improvements these days include insulation, double glazing, safety (smoke alarms, wiring, handrails), less toxicity (no lead pipes), fire-retardant materials, soundproofing, water ingress protection and better lighting.
Modern homes also now include a vast number of products that would have appeared magic to many 50 years ago: dishwashers, microwaves, waste disposal, ice makers, air-conditioning, flat-screen TVs, hooded barbecues, power tools, awnings, decks, garage door openers, security systems, and automatic lights. While there is enormous pressure on housing affordability in some of the most desirable cities, it has not changed so much for most of the middle billion. But hold on, 50 years ago people could buy a house on just one income and now you really need two incomes so surely we are worse off? This a reflection that the average household now has two incomes. With mobile skilled populations all wanting to live in the most desirable places, this certainly drives up prices making it less affordable for many and this adds to the sense of struggle. This particular topic is different from comparing the average house people live in now to 50 years ago.
It seems that people prefer the modern home because that is what they choose. If you have a home from 50 years ago, it has typically been upgraded to include many of the modern features such as decent bathrooms, kitchen and insulation. Even given all these improvements, I’ve only got a gentle slope to show that housing has got better. If anything, it should probably be steeper.

Entertainment/recreation
It may feel like we no longer have enough downtime for recreation and entertainment, but data shows that the middle billion probably have more free time than ever. So how has the quality of entertainment and recreation changed?
• 50 years ago, most TVs were still black and white and tiny by today’s standards.
• Four to five channels if you were lucky, compared with thousands of on-demand options available now.
• No portable music options other than radio — even cassettes were not available. We now have millions of song options available instantly.
• Exercise options were limited and even jogging wasn’t a commonly known word or thing.
• No mountain biking, BMX, windsurfing, paddle boarding or skateboarding — there was line dancing though.
• Book/magazine selection was limited to your local store or library.
• We now have thousands of talks from world experts on any topic of interest at your fingertips.
While some of these entertainment options are a matter of trend, I suspect that no one would want to give up what we have today, and anyone from 50 years ago would struggle to believe the options we have now.
Summary of how the average person is getting on after 50 years
You would have to summarise life compared to 50 years ago as dramatically better by all of these measures. This may seem at odds with your gut feel for how things have changed, and it is different from what some economic models tell us. Before dismissing outright the idea that things are better, check out Part Two of the book Comparonomics, which explains why we feel gloomy, and come back to this analysis.
The economist Don Boudreaux imagined the average American time-travelling back to 1967 with his modern income. He might be the richest person in town, but no amount of money could buy him the delights of eBay, Amazon, Starbucks, Wal-Mart, Prozac, Google.
Because progress has been good to date, this is no guarantee it will go on forever. Nicholas Taleb described the story of a turkey in his book The Black Swan.
Consider a turkey that is fed every day. Every single feeding will firm up the bird’s belief that it is the general rule of life to be fed every day by friendly members of the human race ‘looking out for its best interests,’ as a politician would say. ‘On the afternoon of the Wednesday before Thanksgiving, something unexpected will happen to the turkey. It will incur a revision of belief.
None of this analysis precludes the possibility of some significant change in trends. However, the changes outlined in the comparonomic graphs ride over the top of many black swan events like the global financial crises, 9/11, and the fall of the Berlin Wall. Even if you believe things are about to collapse dramatically, it is still no excuse for not acknowledging the consistent progress we have made lately on a whole range of things. This book is not speculating about the future, just trying to agree on what has happened so far, which seems to be mostly good news.
How conventional economics views the last 50 years
There is a prevailing thought that for a lot of people, there has been minimal improvement in real wages since the 1970s. Most of the increase in wealth has gone to the top 1–10%, and much of the ‘middle class’ or poorer people are not much better off. Two graphs below are typical of the economics charts that show stagnant wages for 50 years.


‘For most workers, real wages have barely budged for decades.’ There are so many assumptions tied up in the statement that it is hard to know where to start unpacking it. I am not going to comment on the mountain of literature that discusses in detail the pros and cons of the assumptions and details. One of the reasons I don’t even try is that the discussion quickly gets so academic that it is not easy for most people to participate in so they disengage. Meticulously researched details count for a lot less when what it measures is so hopelessly flawed. With a comparonomic graph, anyone can participate and build their own view and have a richer, more believable personal view of how things have changed.

The elephant graph highlights some significant differences in income growth over time, although only going back to 1988 rather than 50 years ago. The great news is that lots of low-income people’s incomes are growing rapidly and they are leaping out of extreme poverty. It also highlights how much the top few percent have been booming too. There is obviously some progress to be made to help the poorest people, which probably should be the main conclusion from the graph. The key thing some focus on is how little ‘growth’ there has been in the developed world middle class — there is even comment that this means the middle class is in decline.
A wide range of economic models do not show things are as bad as flat growth or decline. However, it seems that this opinion that life used to be better has made it into public perception.
In a 2015 survey, 70% of Britons agreed with the statement that ‘things are worse than they used to be,’ even though at the time Britons were in fact ‘richer, healthier and longer-living than ever before.’
First time in history — average Americans have less education and are less prosperous than their parents.
1974 would mark a fundamental breakpoint in American economic history. In the years since, the tide has continued to rise, but a growing number of boats have been chained to the bottom.
There is even a term for this called declinism — the belief that a society or institution is tending towards decline. This is primarily attributed to the cognitive bias called rosy retrospection or nostalgia bias and leads to viewing the past favourably and the future negatively. In the following chapters, I flesh out a broader range of quirks in perception that led us to a pessimistic view of current life.
The gloomy economic conclusions reflect in public perception. Pew Research asked ‘Life in our country today is _____ than it was 50 years ago for people like me.’ Half thought better, half worse. Notably, lots of countries in the rich OECD thought things were worse. This sense of despondency about progress has made its way into the public psyche sufficiently that it is commonly believed to influence genuine public opinion and politics. You can’t ‘Make America Great Again’ if it was actually worse in the past.
The middle billion is the 1% from a historical perspective
Historically, an estimated 100 billion people have existed over history. It seems clear that the middle billion are better off than the other 99 billion that have ever existed, and better off by a vast margin. It is a great time to have been born and, from a historic perspective, you are the wealthiest 1%. You are the 1%! It is better than being in the 1% any time in the past because the average person has way more things that were impossible for even kings. I’d estimate that about half the time we use goods or services, they are better than the wealthiest person in the world 50 years ago.
Conclusions
The goal of this analysis was to show how you can create mini thought experiments to gauge how well off you are compared to any time in the past. It is not about my telling you how things are but giving you a tool so you can work it out yourself. The results of significant progress in all sectors seem at odds with the results from conventional economic analysis that implies many of us are not doing much better than 50 years ago.
It is important to note that there is nothing inherently optimistic about this tool. Comparing these same things over the last 20 years in Venezuela is not going to produce a comparonomic graph showing things have got better.
So how does standard economics miss such huge improvements? All the possible explanations have pros and cons but I want to skip the why and move on to the even more perplexing question: Given things have got much better, why don’t we feel any better? Maybe economic productivity is not broken — economic measurement and what we aim for is broken.
The reason this is so important is that if we don’t accurately understand how things are changing, we have little hope of doing things that are likely to make things better. Imagine being in a car and wanting to go faster. If the speedo says you are slowing down, but the speedo is broken, then it is not much use for helping you drive. What I am proposing is to look out the window and see progress for ourselves rather than rely on inappropriate, broken measurement tools.
Hopefully, after this analysis, you will be feeling good about how well off you are compared to even kings or our disco, flared-trouser-wearing 1970s friends.
Note - this is a modified chapter from Comparonomics - the book includes links to the references etc